If you believe a single bright star is too simple to take a photograph, you probably failed.
Introduction
P Cygni is an LBV (luminous blue variable) star, a giant star located in the large asscociation Cygnus OB 1 (Van Schewick, H., 1968). P Cygni is bright enough to be visible for the naked eye in a dark and clear night. However, it is not easy to obtain pretty pictures of the famous star and its surrounding interstellar matter. If one wishes to obtain a picture of an extremely faint H II region, then the star formation Cygnus and the region around P Cygni probably is a good choice for a challenge and test of the equipment. The interstellar matter consists mainly of hydrogen gas of low density. The enormous luminosity of P Cygni hardens pretty pictures of the interstellar matter, and the star itself at the same time. Few professional publication records containing informations about the P Cygni region sounded like an adventure (Meaburn, J. et al., 1999). Some details have been evaluated after expensive image post-processing.
P Cygni currently is suspected to show variability in some spectroscopic and photometric details. While it is interesting to find out the reasons for the variability, an international observing campaign started with the organizations AAVSO, ASP and BAV (Pollmann & Bauer, 2011).
Observations and comparison to the POSS plates
P Cygni is a giant star with a gas shell. It will be interesting to see, whether and how this shell can be made visible and observed over a certain period. I started my first attempt to get an idea about reasonable exposure time for astrophotography of the P Cygni region.
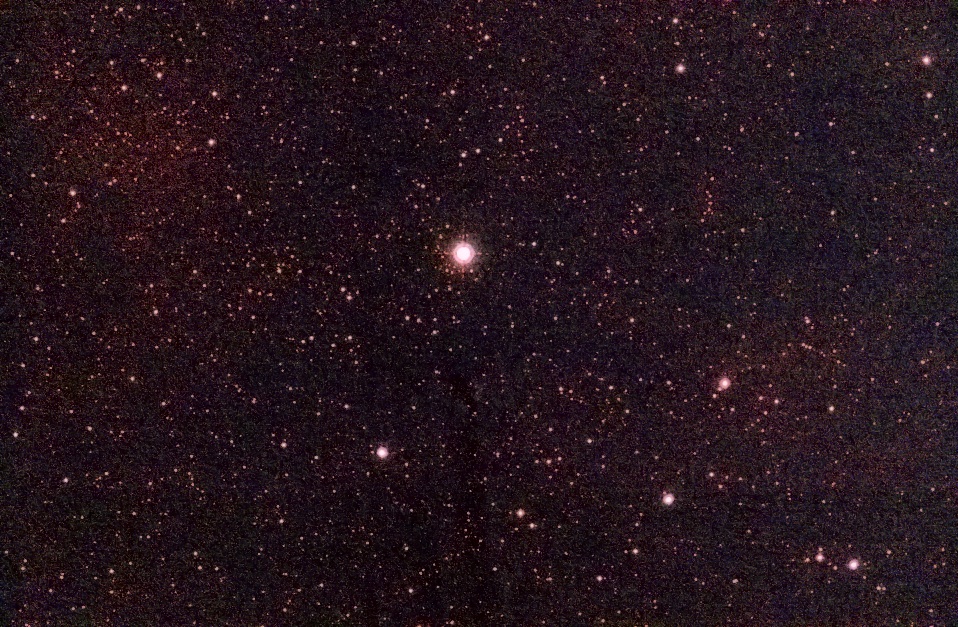
Figure 1: Image of P Cygni (center) and the surrounding H II Regions. Details about exposure are presented at the end of this article. Click to enlarge.
The image of P Cygni is practically saturated if an exposure time of more than a fraction of a second is used. Therefore, seems impossible to image both, the hydrogen gas and the star with broadband filters. With a narrow-band H-alpha filter the light of the star is reduced and the faint interstellar matter may be amplified with large exposure times. Again, the star would be saturated with too long exposure. Therefore, exposure time was limited to 30 seconds for each frame. To obtain a good limiting magnitude in the bright moon light, many exposures have been taken and stored. Finally the exposures were added together using a modified shift-and-add procedure. The final image now consists of 50 images.
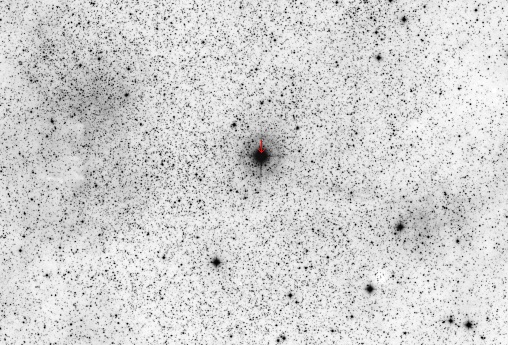
Figure 2: Same region as shown in figure 1, but taken from a low resolution scan of a Kodak 103a-E plate of the Palomar Observatory Sky Survey (DSS2). Image obtained with the software Aladin of the Centre de Données astronomique des Strasbourg. While the plates show more details with contrast enhancement, this is the default view as shown by Aladin.
Noise and Limiting Magnitude
Adding 50 images of 30 seconds exposure time yields a total exposure time of 25 minutes. However, the effective exposure time is smaller. Camera readout noise adds some noise with every single image. A careful analysis of the resulting image yielded a standard deviation of 18 DU (digital units) for the total noise in the star-less areas of the resulting image. The quantum conversion rate for the Canon yields 0.84 e- for 1 digital unit at ISO 400 (C. Buil, unkown date), or in a first order approximation one photo electron per digital unit. While the camera itself has a dynamic range of 14 bit, the resulting image is computed at double floating-point precision and streched to 16 bit (intensities multiplied by four). So 18 DU include an average noise of 4.5 DU. Of course, this is less than the readout and dark current noise of one single raw image and a result of an average process of 50 frames. The single raw frames have a standard deviation which is 7 times larger, this is close to the detector noise level evaluated earlier (Bauer, 2008). The mean value of the sky background has a subtle offset of 4 DU after dark frame subtraction from artificial illumination of the night skies. Signal-to-noise ratio of these portions of the image is less than 1. Because the intensitiy distribution is extended over a large area, the faint illumination is visible in both the Palomar plates and my own image.
From earlier studies I detected a limiting magnitude of Vmag=20 with exposures at around one to two hours. This is given by a signal-to-noise ratio of the peak intensity of point light sources against the mean value of the noise (values around 50 DU to 300 DU of standard deviation). The limiting magnitude is set by the bright sky illumination of a suburban observatory site. In the case of my P Cygni picture, and with H-alpha filtering, most of the light pollution is cut by the filter. The photon noise (Poisson distribution) is much lower. Therefore, the intensity of the illumination may be estimated to a value of less than Vmag=20. However, limiting magnitudes in a narrow-band filter are difficult to compare. In this case, the peak intensity of the H II region is set in contrast to observations of star clusters in distant galaxies taken with broadband filters. This limiting magnitude is not related to the stars detectable in the image, because their apparent magnitude is cut and reduced by the narrow-band H-alpha filter. Taking a limiting magnitude in this case is neither a photographic, nor a visual magnitude. And the faint glow of any H-alpha emission remains invisible to the naked eye. The limiting magnitude estimated depends mainly on consideratiopn of the signal-to-noise ratio of intensities and is compared to a different signal found in a different photograph with another filter and standard deviation of the noise.
Erroneous measure of brightness
It shall be mentioned, that some authors calibrate the magnitude of an H II region or nebula to the brightness of a star found within the same photograph. However, this procedure will not reflect the true apparent magnitude of the nebula within the broad visible spectral range. If one wishes to evaluate distant H II regions in distant galaxies like Messier 51, these H II regions are sometimes given with a brightness of around 12 mag, while they are hardly visible in a photograph with a limiting magnitude of Vmag=20. A difference of 8 magnitudes between the detection limit of a star and the H II region represents an error of a factor 500 of the true value! With a narrow-band interference filter, like an H-alpha filter, individual stars appears much darker, because the camera will record just a small fraction of the star light around Hα line. This is why some magnitudes will not match expectations of an astrophotographer. The method presented in the preceeding section will compare magnitudes based on the intensity found in a pixel, or in a small and comparable portion of the image (e.g. 2x2 pixel). Therefore, it will resemble the total flux of an assumed point light source related to certain signal-to-noise constraints.
Conclusion
The interstellar matter around P Cygni is discovered within an image taken with a DSLR. The very faint H II region is demonstrated and even dark clouds are recovered from the observed signal. Structures identified are found below the limit of marginal detection. Despite marginal detection, it is an amazing result for a digital single reflex camera with a 20 cm class telescope and short exposure time. It seems impossible to obtain similar results from the raw frames without further expensive image processing. This reflects well the difficulties found even with larger exposure time of 7000s at a larger telescope and using CCD detectors reported in the literature (O'Connor et al., 1998). To achieve the result presented in this work, the author developed a new process chain for a DSLR camera and a new noise model resulting in a new image calibration process including a dedicated noise filter to recover the signal. The discovery of the faint H II region demonstrated a successful application of the new technique. The shell of P Cygni, however, is not demonstrated with this technique. The Giant Lobe close to P Cygni and discussed in the literature (O'Connor et al., 1998 and Meaburn, J. et al., 1999) is found below the detection limit of my own photograph. The shell around P Cygni is hard to detect due to the enormous brightness of the star itself. The gas shell is believed to lie within a small portion of the image located around the star and therefore needs high-resolution imaging techniques to be resolved.
Literature
Bauer, T., 2008. "The RAW Image File Format Problem - Applications of Digital SLR Cameras in Astronomy and Science", Proceedings of the 4th Annual Meeting on Information Technology & Computer Science at the BA-University of Cooperative Education, H. Weghorn (Ed.), Stuttgart, ISSN 1614-2519
Buil. Ch.: "Comparaison des Canon 40D, 50D, 5D et 5D Mark II", last visited on 1. February 2011, -> goto website
Meaburn, J. et al., 1999. "The Kinematical Association of a Giant Lobe with the Luminous Blue Variable Star P Cygni". Astrophysical Journal, vol. 516, issue 1, pp. L29-L32
O’Connor, J. A. et al., 1998. The Manchester occulting mask imager (MOMI): first results on the environment of P Cygni. Monthly Notices of the Royal Astronomical Society, Volume 300, Issue 2, pp. 411-416
Pollmann E., Bauer, T., 2011. International Observing Campaing: Photometry and Spectroscopy of P Cygni, The American Association of Variable Star Observers, AAVSO Newsletter January 2011, p.12
Van Schewick, H., 1968. "Eigenbewegung und absolute Helligkeit des Hüllensterns P Cygni". Zeitschr. für Astrophysik, Vol. 68, p.229
"The Aladin Sky Atlas", Centre de Données astronomique des Strasbourg, last visited on 1. February 2011, -> goto website of Aladin 7
Observational data
| Telescope: | Vixen VC200L, focal reducer f/6.4, Sphinx SXD |
| Camera: | Canon EOS 40D-a, ISO 400, Astronomik H-alpha 12nm filter |
| Exposure: | 50 x 30 s, manually selected |
| Calibration: | Dark (50 images), sky flatfield (50 images) |
| Image Processing: | Shift & add with correction of subpixel movement, improved noise reduction |
| Date of exposure: | 10 October 2010, 19:50 h MEZ |
| Software: | ArgusPro SE, some post-processing with Photoshop CS3 |
| Remark: |
The H II regions are hardly visible at the limit at Vmag<20. |