 Asking amateur astronomers about the stellar magnitudes of the faintest objects seen in their photographs, I always get the answer: I don't know, and I don't know how to do this.
Determination of the limiting instrumental magnitude of the objects found in an astronomical artwork is not a difficult task. The famous galaxy Messier 51 is one of the galaxies, that have been examined well. From using space telescopes high-resolution images are available to determine instrumental magnitudes of the brightest objects in this galaxy. This article shows how to do that.
Photometric base data
In most cases, I use Simbad from the Centre de Données astronomiques de Strasbourg (CDS). Another powerful tool is Aladin, which can also downloaded via CDS portal website. It is written in Java programming language and comes with no cost. If you don't want to download this tool, you can run a query from Simbad or CDS portal to browse online. Here I will describe the use of the Aladin programme, which can be interactively used to browse the sky on your laptop or computer.
Link to Simbad website and Aladin download: Centre de Données astronomiques de Strasbourg (CDS).
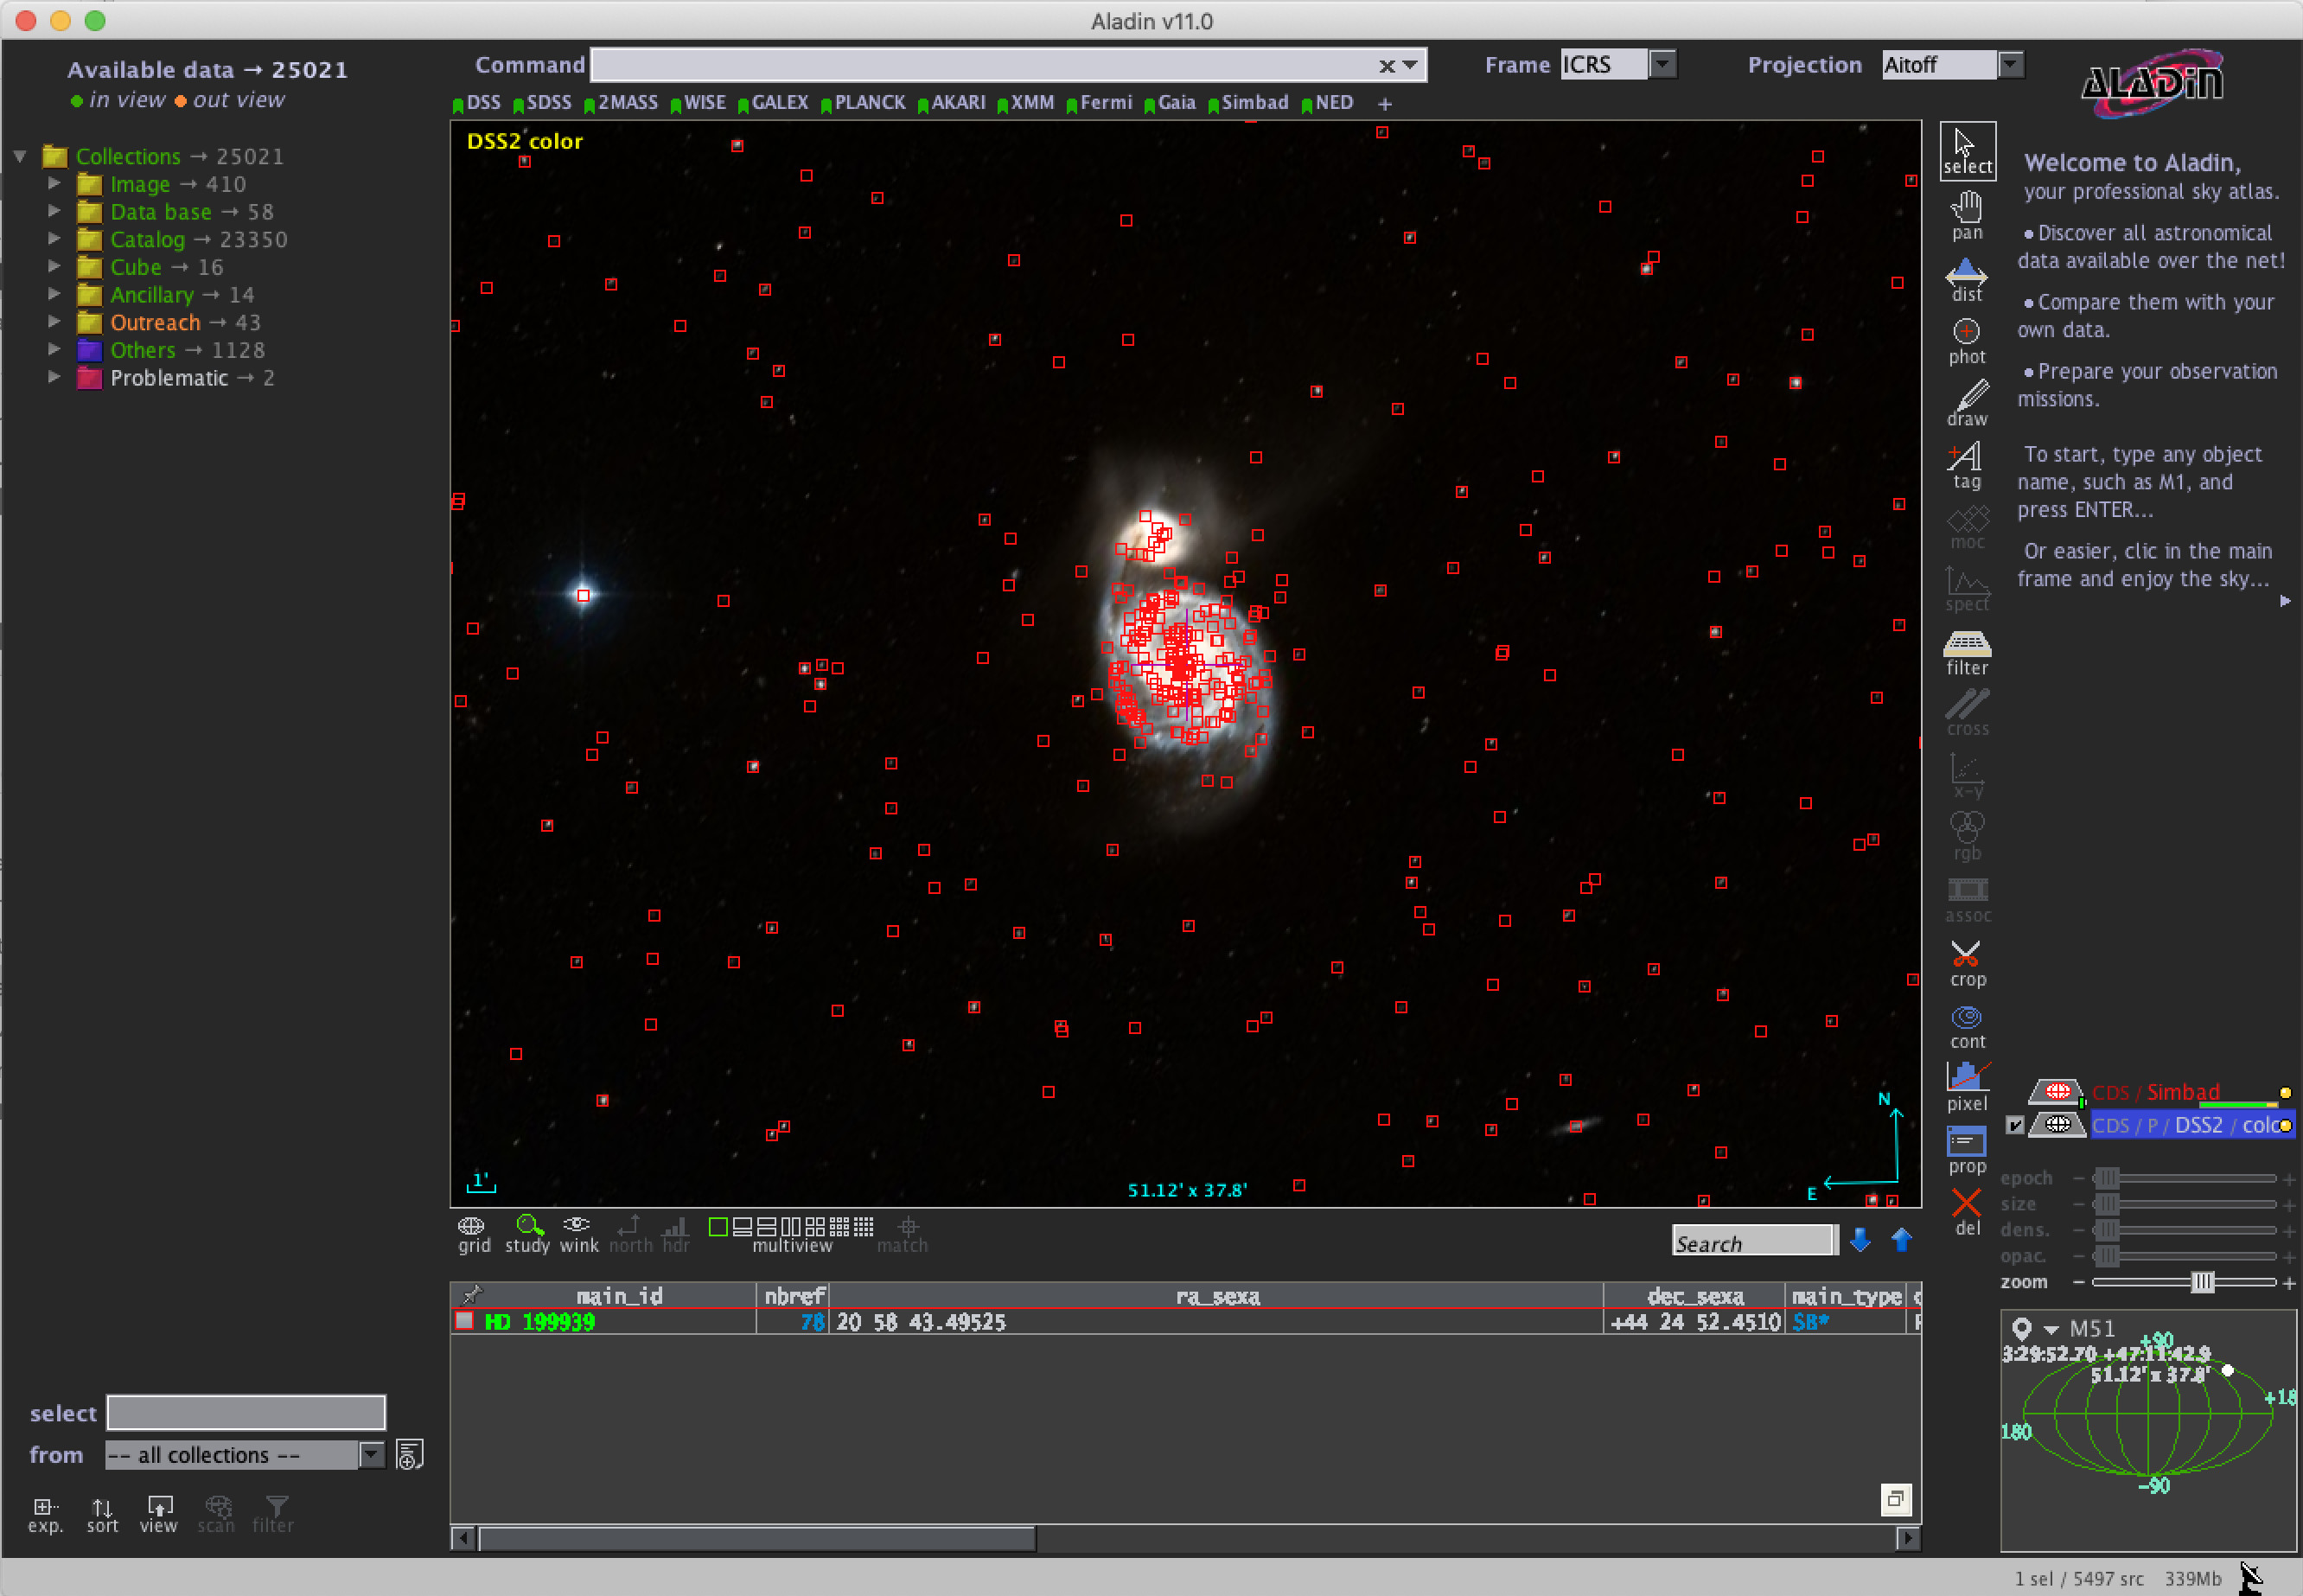
Let's assume, we want to explore the surroundings of the galaxy pair Messier 51. Enter the name "M51" to look for Messier 51 and hit enter key. This will yield a basic image of the galaxy pair with additional data presented in a table below. The default visible angle is about one arc minute (1'), which also matches well a wide field eye piece of a medium size amateur telescope.
From the File menu select Data bases (Simbad, NED, ...) and select Simbad Astronomical Database catalog. This will add a new plane on the left side and a new layer on top of the image. Known objects from Simbad database will appear on top of the finding chart. Try to zoom in and out to get to the details of photometric information of the many star-like objects or knots of the spiral arms. Many photometric magnitudes are provided from publications done with the Hubble space telescope.
Photometric comparison to own imagery
The many objects displayed on top of the finding chart can be clicked and selected with your mouse cursor to get available data. The data of the selected object and a list of nearby objects is shown in the data table that pops up below the finding chart. Close to the identifier or name of the object you will find the main type of any star-like object. Many of the knots are dense star clusters or H-II gas nebula, that might also appear in your own image. Scroll a bit more to the right to see the different recorded data about brightness, that are the stellar magnitudes in blue (B), visual (V) or red (R) color. Uppercase letters J, H or K stand for infrared color bands observed with different filters outside the visible B, V and R bands. lower case letters u, g, r, i and z are recorded by the Sloan Digital Sky Survey (SDSS) and may also.
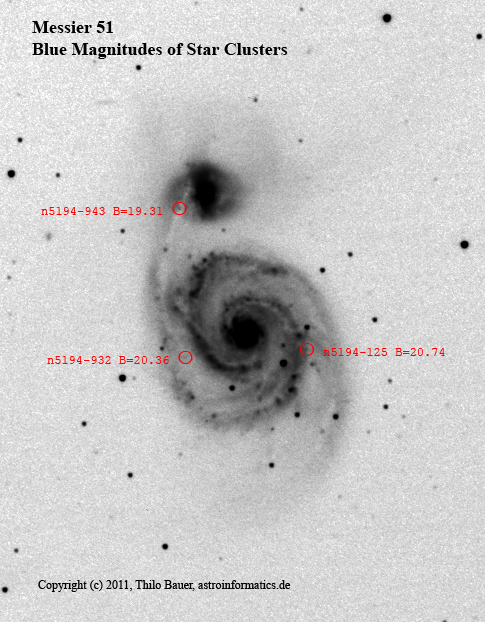
If you interested in getting a rough estimate of the limiting magnitude from your image, you don't necessarily need any specific software tool to measure stellar brightnesses. Just create a black and white copy of your artwork. Take a tool like Photoshop or Gimp, extract the green color channel and convert the green image plane into an inverted black and white image. This should be contrasted in a way, that everything which appears bright is now black. Any faint stellar or gaseous objects found in the image should appear gray just above noise level. The following image shall provide an idea of how your contrasted b&w image will look alike.
There bright spots marked in M51 are not single stars, but star clusters. These star clusters are likely extended clusters, like those famous clusters like h and χ Persei (NGC 869 and NGC 884), that we can observe in the Northern skies within our own galaxy. However, the clusters appear like point-light sources or stars, because of their large distance from earth. I marked some of these clusters with their relative B magnitudes (brightnesses). Try to find these spots yourself in Aladin software, click on it to figure out V and B magnitudes presented in the table below the image in Aladin. V denotes "visual" color. The naming V for visual is a historically grown from an epoch, where chemical photographic plates recorded in visual spectral band. Such photographic plates were common in astronomy in this epoch. Other photographic plates where sensitive for blue or ultra-violet light. V denotes a filter band around yellow-green, while B magnitudes denote blue color bands. These different colors typically are measured in specific calibrated astronomical filters of the Johnson UBV(RI) filter bands. Other colors listed in the table are U for ultraviolet, R (red) or I for near infrared light. Your DSLR or other color astro-camera will record in filter bands B, G and R, where B denotes blue, G denotes green and R denotes red light portions. These filtered light color portions are very close to the astronomical Johnson filter bands. More specifically, the color system of your DSLR can be mathematically transformed into Johnson BVR colors by using calibration techniques. I will writeup another article on how to explain this in the near future. Simply think of your green G color channel from your DSLR or color camera astro-image as the V band (color channel) of the Johnson filter system.
If you have done this task for the green color channel to estimate V color limiting magnitude, do that exact same task, but now using the blue color channel of your DSLR or color camera artwork. Now you have to compare against the B values listed in Aladin brightness table.
You may notice not every star cluster or star may provide both measures, if not lacking any Johnson magnitude (missing). Some spots might be provided with B measures, other just provide V measures, while any other stellar content might provide no color magnitudes measured in Johnson filter system. This is because the many different astronomical institutes may use different filter systems. On the other hand the brightnesses listed in Aladin are mixed up from many different sources. Many of the measures of M51 may come from publications using the famous Hubble space telescope. Apart from the Johnson filter system, Stromgren filter bands are also popular in astronomy. Stromgren filter bands are not as broad compared to the broad-band Johnson filter system, which has overlapping spectral color filter transmission curves. Some exotic proprietary filter systems are provided by certain observatories or come with modern satellite observatories, that cannot easily be transposed into Johnson filter system. This is because the filter curves differ too much from the Johnson UBVRI filter bands. If you want to measure stellar magnitudes using any DSLR or color astro-camera, I recommend to compare agains measurements provided for the Johnson B, V and R filter system. If you use a monochrome imaging sensor or a modified DSLR you might explore the outer U and I bands of the Johnson filter bands, that are ultra-violet and infrared. A modified DSLR may be used to explore ultra-violet light up to 360 nm wavelength. Many CCD or the more modern CMOS imaging sensors are also susceptible to infrared wavelength, thus can be used in combination with I filters to measure in the infrared light.
You likely identified brightness estimates that should be at least between V=19 and V=21 for short exposure imaging with just a few minutes of exposure time and any 6-8 inch telescope. Congratulations, you've just hit a personal record of having found very faint stellar-like objects of limiting magnitude around V=20. Probably, you didn't expect your recorded image will represent stellar contents of such faint brightness. Surprise!
Take care. If you use any monochrome imaging camera without using a color filter in the light path, then stellar brightnesses can hardly be well estimated. The reason is, that a monochrome image sensor typically records all spectral intensity from ultra-violet ti near infrared. However, there are color deviations for different stars, clusters or nebulae along the spectral color range. For example, as the name indicates, an old red giant star appears yellow to red in a teleskop, while hot young stars will appear blue. Such a blue-yellow color contrast can easily be observed when observing the beautiful binary star Albireo in Cygnus star formation.
Limitations
The method is limited by itself: Often stars around V=20 are the faintest stars listed in Simbad database. This is not the case for the example of M51, where multiple surveys are brought together with Simbad database. Star-like objects down to B=24 are available in this field from Simbad database. However, this heavily depends on the field of view that is of interest. In most cases a more sophisticated approach to measure stellar brightness with any astronomical tool is preferred over a rough estimate.
Conclusion
The method described here provides a rough estimate of the limiting magnitude from a contrasted black and white copy of an image taken from the galaxy pair Messier 51 and NGC5195. For the beginning astrophotographer this method is easy to apply to learn about detection limit of the owners specific astronomical equipment.
Literature
- Link to Simbad database
- Link to Aladin lite interactive online version
- Larsen, S. S., 2004. The structure and environment of young stellar clusters in spiral galaxies. Astronomy and Astrophysics, v.416, p.537-553
- Larsen, S. S., 2000. Young massive star clusters in M 51. Monthly Notices of the Royal Astronomical Society, vol. 319, issue 3, pp. 893-901


